Many marketers are now marketing on TikTok, but they often have difficulty evaluating their marketing effectiveness. Recently, TikTok has provided them with an effect analysis tool called TikTok Analytics. This article will take you to learn more about TikTok Analytics.
1. Switch to TikTok Pro account to access TikTok Analytics
It is reported that TikTok recently launched its own analytics tool for Pro accounts (similar to Instagram Creator accounts). TikTok’s analytics tools provide insights into an account’s overall audience and the performance of posted content.
Switching to a Pro account is easy. First go to your profile settings and click on the ‘Manage My Account’ option. On the next page, click Switch to Pro account.
 Next, you’ll be prompted to choose a category for your account. Categories include Public Figures, Personal Blogs, Education, Media, Entertainment, and more.
The final step is to enter the phone number for the account, followed by the verification code received via SMS.
 Once you’ve set up your Pro account, by navigating back to the “Settings” menu, you’ll see an “Analytics” option. Click this option to open the TikTok Analytics page.
After switching to a Pro account, TikTok Analytics will start recording data and the page will not show any historical data. You will need to wait up to 7 days for the account to generate enough data and provide insights. During this time, it is recommended that you publish as much content as possible to gain deeper insights.
Once you have Analytics data, you can drill down into your account information. The more content is published, the more accurate the data will become.
TikTok displays data in 3 main categories:
· Profile overview;
· Content insights;
· Follower insights.
You can click the tabs at the top of the Analytics page to dig deeper into each category and discover new insights.
2. Profile Overview
The Profile Overview can be used to determine the overall performance of a TikTok account, including total video views, profile views, and followers.
Video Views
The top of the “Overview” tab displays Video Views, which is the total number of views for the video in the past 7 or 28 days, broken down by day.
 Profile Views
The profile views metric is the number of times a user has viewed a TikTok profile in the past 7 or 28 days. This information is on a daily basis, so you can see what’s driving users to your profile.
 Follower Count
The follower count graph will show the total number of followers over a 7-day or 28-day period.
 Follower Insights allows you to connect popular TikTok videos to your account’s followers, see how long the content has been published and compare it to the growth rate of followers, so you can assess whether your content is enough to attract users to your brand .
 Tip: You can use profile overview data to explain the growth of your user funnel, it is recommended to start with people who start viewing your content and then those who click to follow and become followers.
This allows you to estimate the total video views and the conversion rate of users who visit your profile, and then use that to estimate the conversion rate of users who actually follow your account.
This analytics data can help you plan an effective content strategy. Knowing your content conversion rate will allow you to schedule your posts and be able to more accurately determine your account growth rate.
3. Followers Data
The “Followers” tab in TikTok Analytics provides data on demographics. You can see the audience by gender as well as the percentage of the audience by location.
 4. Content Data
The “Content” tab in TikTok Analytics provides a wealth of insights. You can see the total views for each video post over the past 7 days, with the ability to display them in chronological order.
 The data also provides on the “For You” page which videos were popular over the past 7 days, and the total number of views these videos generated during that time.
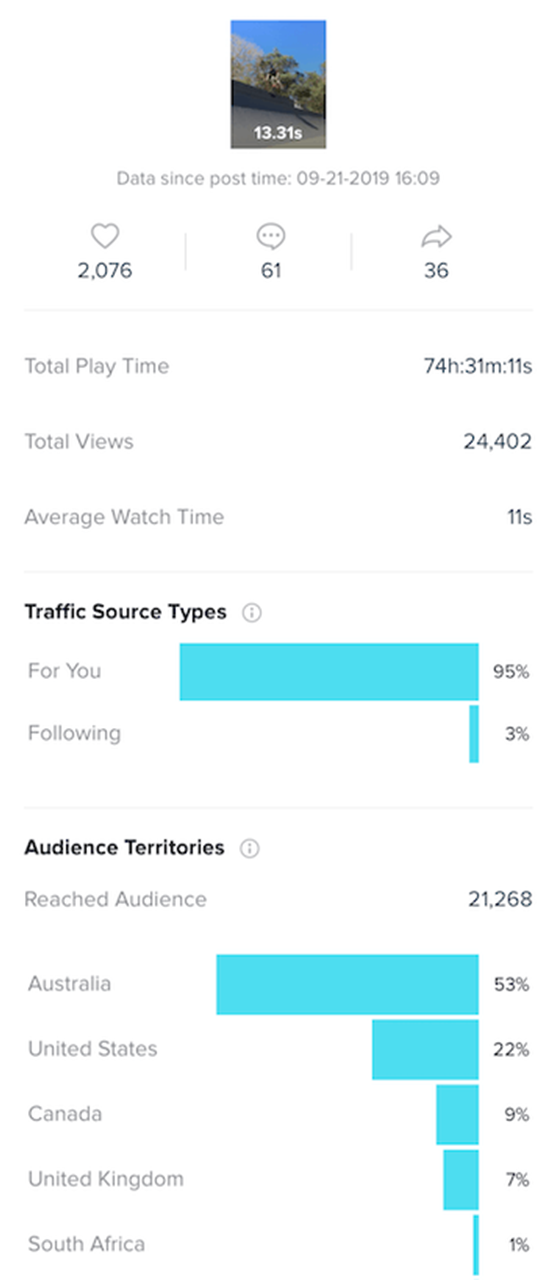
Content Analytics has a feature that helps you drill down into each post and discover richer insights. To see analytics for a single post, just click on the post thumbnail, analytics for each post provides the following data:
· Total like count of post;
· Total number of comments;
· Total shares;
· Total play time of the video;
· Total video views;
· Average watch time;
· Traffic source types;
· Audience territories.
 Audience Territories data can help you determine whether specific content will resonate with different audiences.
By looking at regional engagement for individual posts, you can compare this data with the overall audience reach shown on the Followers tab. Then see if different forms of content resonate with new audiences from different locations. If you find that certain posts perform better in certain regions, you can create more similar content.
5. Use Pentos to analyze other TikTok accounts
As powerful as the analytics tool that comes with TikTok is, it doesn’t give you insights into the performance of other people’s accounts. If you want to know the data of competitors or influencers who are interested in cooperation, TikTok can’t provide relevant data.
And a platform called Pentos leverages publicly available profile data to provide insights about TikTok accounts.
Pentos can measure data from third-party TikTok accounts, and you can analyze the performance of other accounts and gain insights into what’s trending in hashtags.
Free Pentos account, up to three accounts can be tracked. For additional features and hashtag analytics, you need to pay, starting at around $20/month.
Unlike the analytics tools that come with TikTok, Pentos will display historical profile data as soon as you start tracking your account.
To start using this tool, you need to log in to your account and enter the username you want to track.
 You’ll then see a dashboard showing data for that TikTok account. These data include:
· the average engagement rate of the profile;
· The total number of “likes” received;
· Total number of videos posted;
· The number of “likes” comments;
· Average number of comments;
· The total number of accounts that the account follows.
 Unlike TikTok’s own analytics capabilities, Pentos calculates the average engagement rate of a profile. If you are interested in working with an influencer, this is an important metric for evaluating an influencer’s account.
After analyzing 15,000 TikTok profiles, Influencer Marketing Hub provides an average engagement rate based on account size:
0-10,000: 9.38%;
10,000-100,000: 8.43%;
100,000-500,000: 7.23%;
500,000 – 1 million: 4.88%;
1 million – 5 million: 4.99%;
5 million – 100 million: 3.35%;
· Over 100 million: 3.07%.
The average engagement rate on TikTok is much higher than on Instagram, and TikTok presents an opportunity for brands that are currently working with influencers.
In addition to profile analytics, Pentos also provides insights on hashtags. It’s a powerful tool for brands looking to keep up with trends and create content for high-engagement topics. By determining the performance of popular hashtags, you can quickly determine whether it’s worth spending time creating content for relevant hashtags.
The hashtags page provides the following data:
the average engagement rate of the hashtag;
· The total number of views of the tagged content;
the total amount of content on the label;
· Average “likes”.
 Let’s say you’re an e-commerce brand that sells custom phone accessories, and you notice the #newphone hashtag on your TikTok “Discover” page.
Since TikTok hashtags are time-sensitive and driven by what’s trending right now, you need to post relevant content before the hashtags become saturated or outdated. By using the Hashtag Insights tool, you can determine the total number of posts under a hashtag and their average engagement rate.
As you can see from the analysis below, #newphone has an average engagement rate of 0.21%, while the hashtag has an average engagement rate of 0.15%–0.3% overall. This data-driven approach can help you develop TikTok content.
 The process of creating a Pentos hashtag dashboard is similar to creating TikTok analytics. Just enter the hashtags you want to follow. After verification, the dashboard will provide data about the hashtag.
The Pentos hashtag analysis tool can also help you evaluate the performance of the branded hashtags you create.